Analytics that turn your numbers into decisions
Pulse brings revenue, customers, transactions, and traffic into one fast, beautiful dashboard. Track what matters, spot trends early, and export everything whenever you need it.
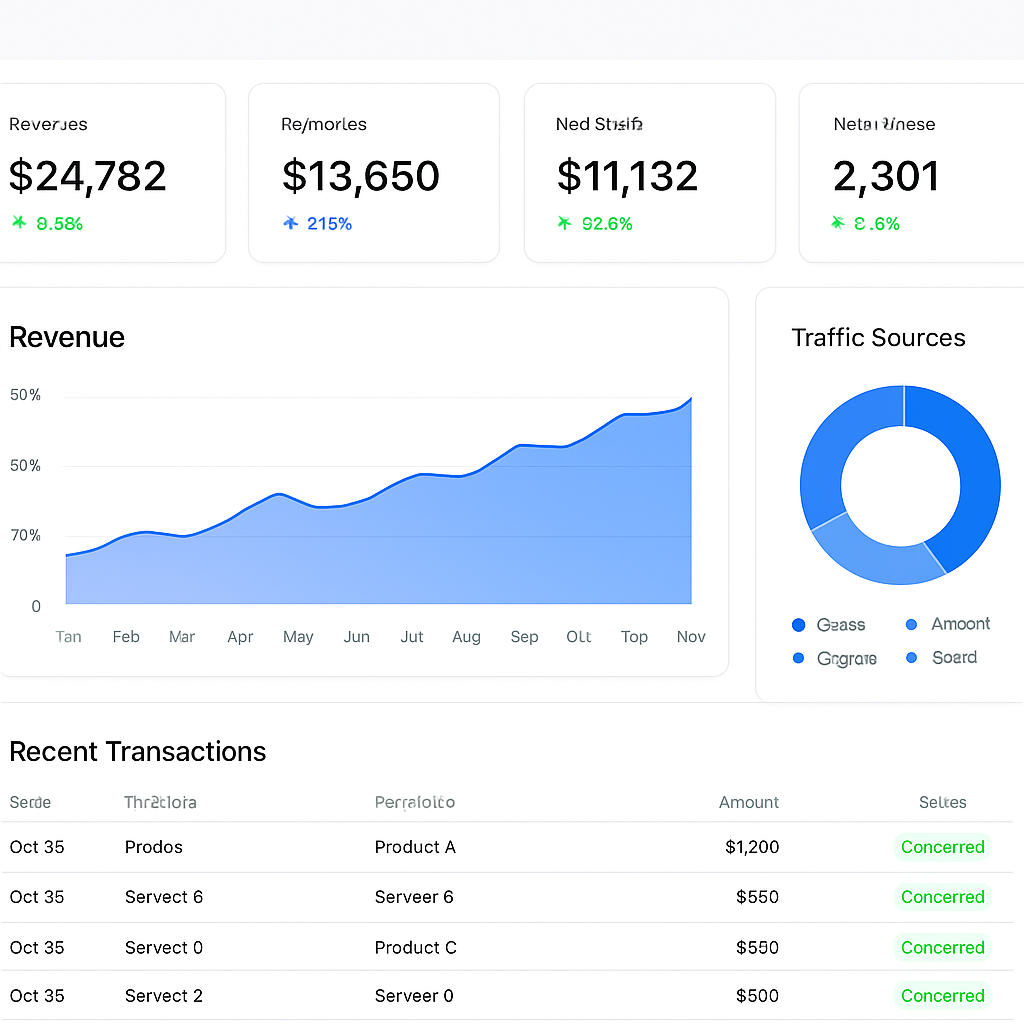
Everything you need to understand your business
A focused toolkit for monitoring the metrics that drive growth, without the bloat.
Real-time revenue insights
Track revenue, transactions, and conversion rate with period-over-period comparisons at a glance.
Customer intelligence
See lifetime value, purchase history, and active vs. churned customers in a searchable directory.
Flexible date ranges
Slice every metric by the last 7, 30, or 90 days and watch the whole dashboard update instantly.
One-click CSV export
Export your transaction data for the selected range and take it into any spreadsheet or BI tool.
Fully self-hostable
Runs on any VPS, Docker container, or Node host. Point it at your own Postgres and you own it all.
Fast by default
Server-rendered pages and aggregated SQL queries keep the dashboard snappy even with lots of data.
Ready to see your numbers clearly?
Create an account and we'll spin up a demo workspace with realistic data so you can explore everything in seconds.